STOCKS: reversal chart patterns
Practice
On May 27, there was a notable drop in the stock market at the beginning of the American session. Later on, most stocks picked up making a quick reversal. That gives us a good opportunity to check for the reversal chart patterns and compare them between different stocks. We will take three from different market sectors to avoid industry-like pattern repetition: Amazon, Netflix, and Amazon. See below.
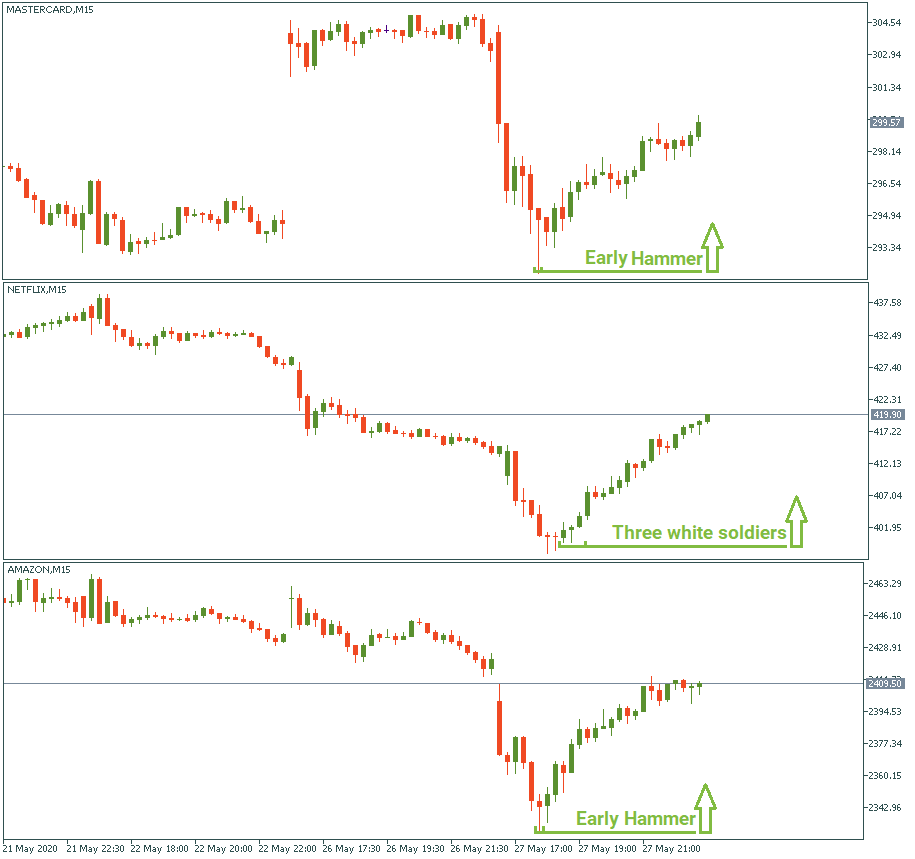
At the bottom of each drop, we have early signs of a bullish reversal. Amazon and Mastercard have a hammer chart formation at the bottom of the downswing. Although both hammers are of the same color as the red of the bearish candles, it may be taken as an early precursor of a possible change of market mood. Netflix, in turn, had several bullish candles in a row which laid the start of the upswing we see.
Theory
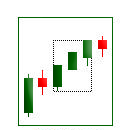
Hammer
Hammer is useful because it is a 1-candle pattern. It does require confirmation and time-verification just as all other patterns but it is easy to pick it out from the chart because it has a very distinctive form. Works both in bullish and bearish reversals.
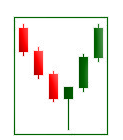
Three white soldiers
It doesn’t have to be exactly three – in the example of Netflix on May 27 we see series of four bullish candles in a row. The idea is that if after a large bearish move suddenly several bullish candles appear one after another, that means a high potential of a bullish reversal.
You can check the other formations in our article specifically dedicated to reversal patterns – use it and make it work for you!